The CommuteCA R package was created to provide analysis-ready datasets from the 2021 Census of Population, along with standardized methods and customized functions for performing urban accessibility in Canada. We focused our efforts on processing variables from the Commuting Reference Guide, which provides valuable variables and information on commuting to work for the Canadian population aged 15 and older living in private households.
The name of the package, CommuteCA, references the commuting section of the 2021 Canadian Census of Population. This package was created in conjunction with the office of the Research Data Center at McMaster University, the Sherman Centre for Digital Scholarship and the Mobilizing Justice.
The Mobilizing Justice project is a multidisciplinary and multi-sector collaboration with the objective of understand and address transportation poverty in Canada and to improve the well-being of Canadians at risk of transport poverty. The Social Sciences and Humanities Research Council (SSRHC) has provided funding for the project, which was created by an unprecedented alliance of academics from various Canadian provinces and institutions, transportation firms, and nonprofit organizations.
Structure
CommuteCA consists of a series of R datasets and R Markdown files created to calculate job accessibility for any study area in Canada using the 2021 Census of Population as the primary data source. The source data (the demographic census) is restricted and requires controlled access, meaning it must be processed within a Research Data Center (RDC) office. The package includes datasets and R Markdown files that enable accessibility analysis for two spatial units:
- Census Tracts, available only for Census Metropolitan Areas and Census Agglomerations.
- Dissemination Areas, a Statistics Canada spatial unit available nationwide.
For Census Tracts, the package provides datasets and R Markdown files that allow researchers and transport practitioners to generate job accessibility measures and maps without needing to visit an RDC office.
For Dissemination Areas, we developed R Markdown files that split the process of calculating and analyzing accessibility metrics into distinct steps. This structure simplifies data processing, given the restricted nature of the source data.
Data sets
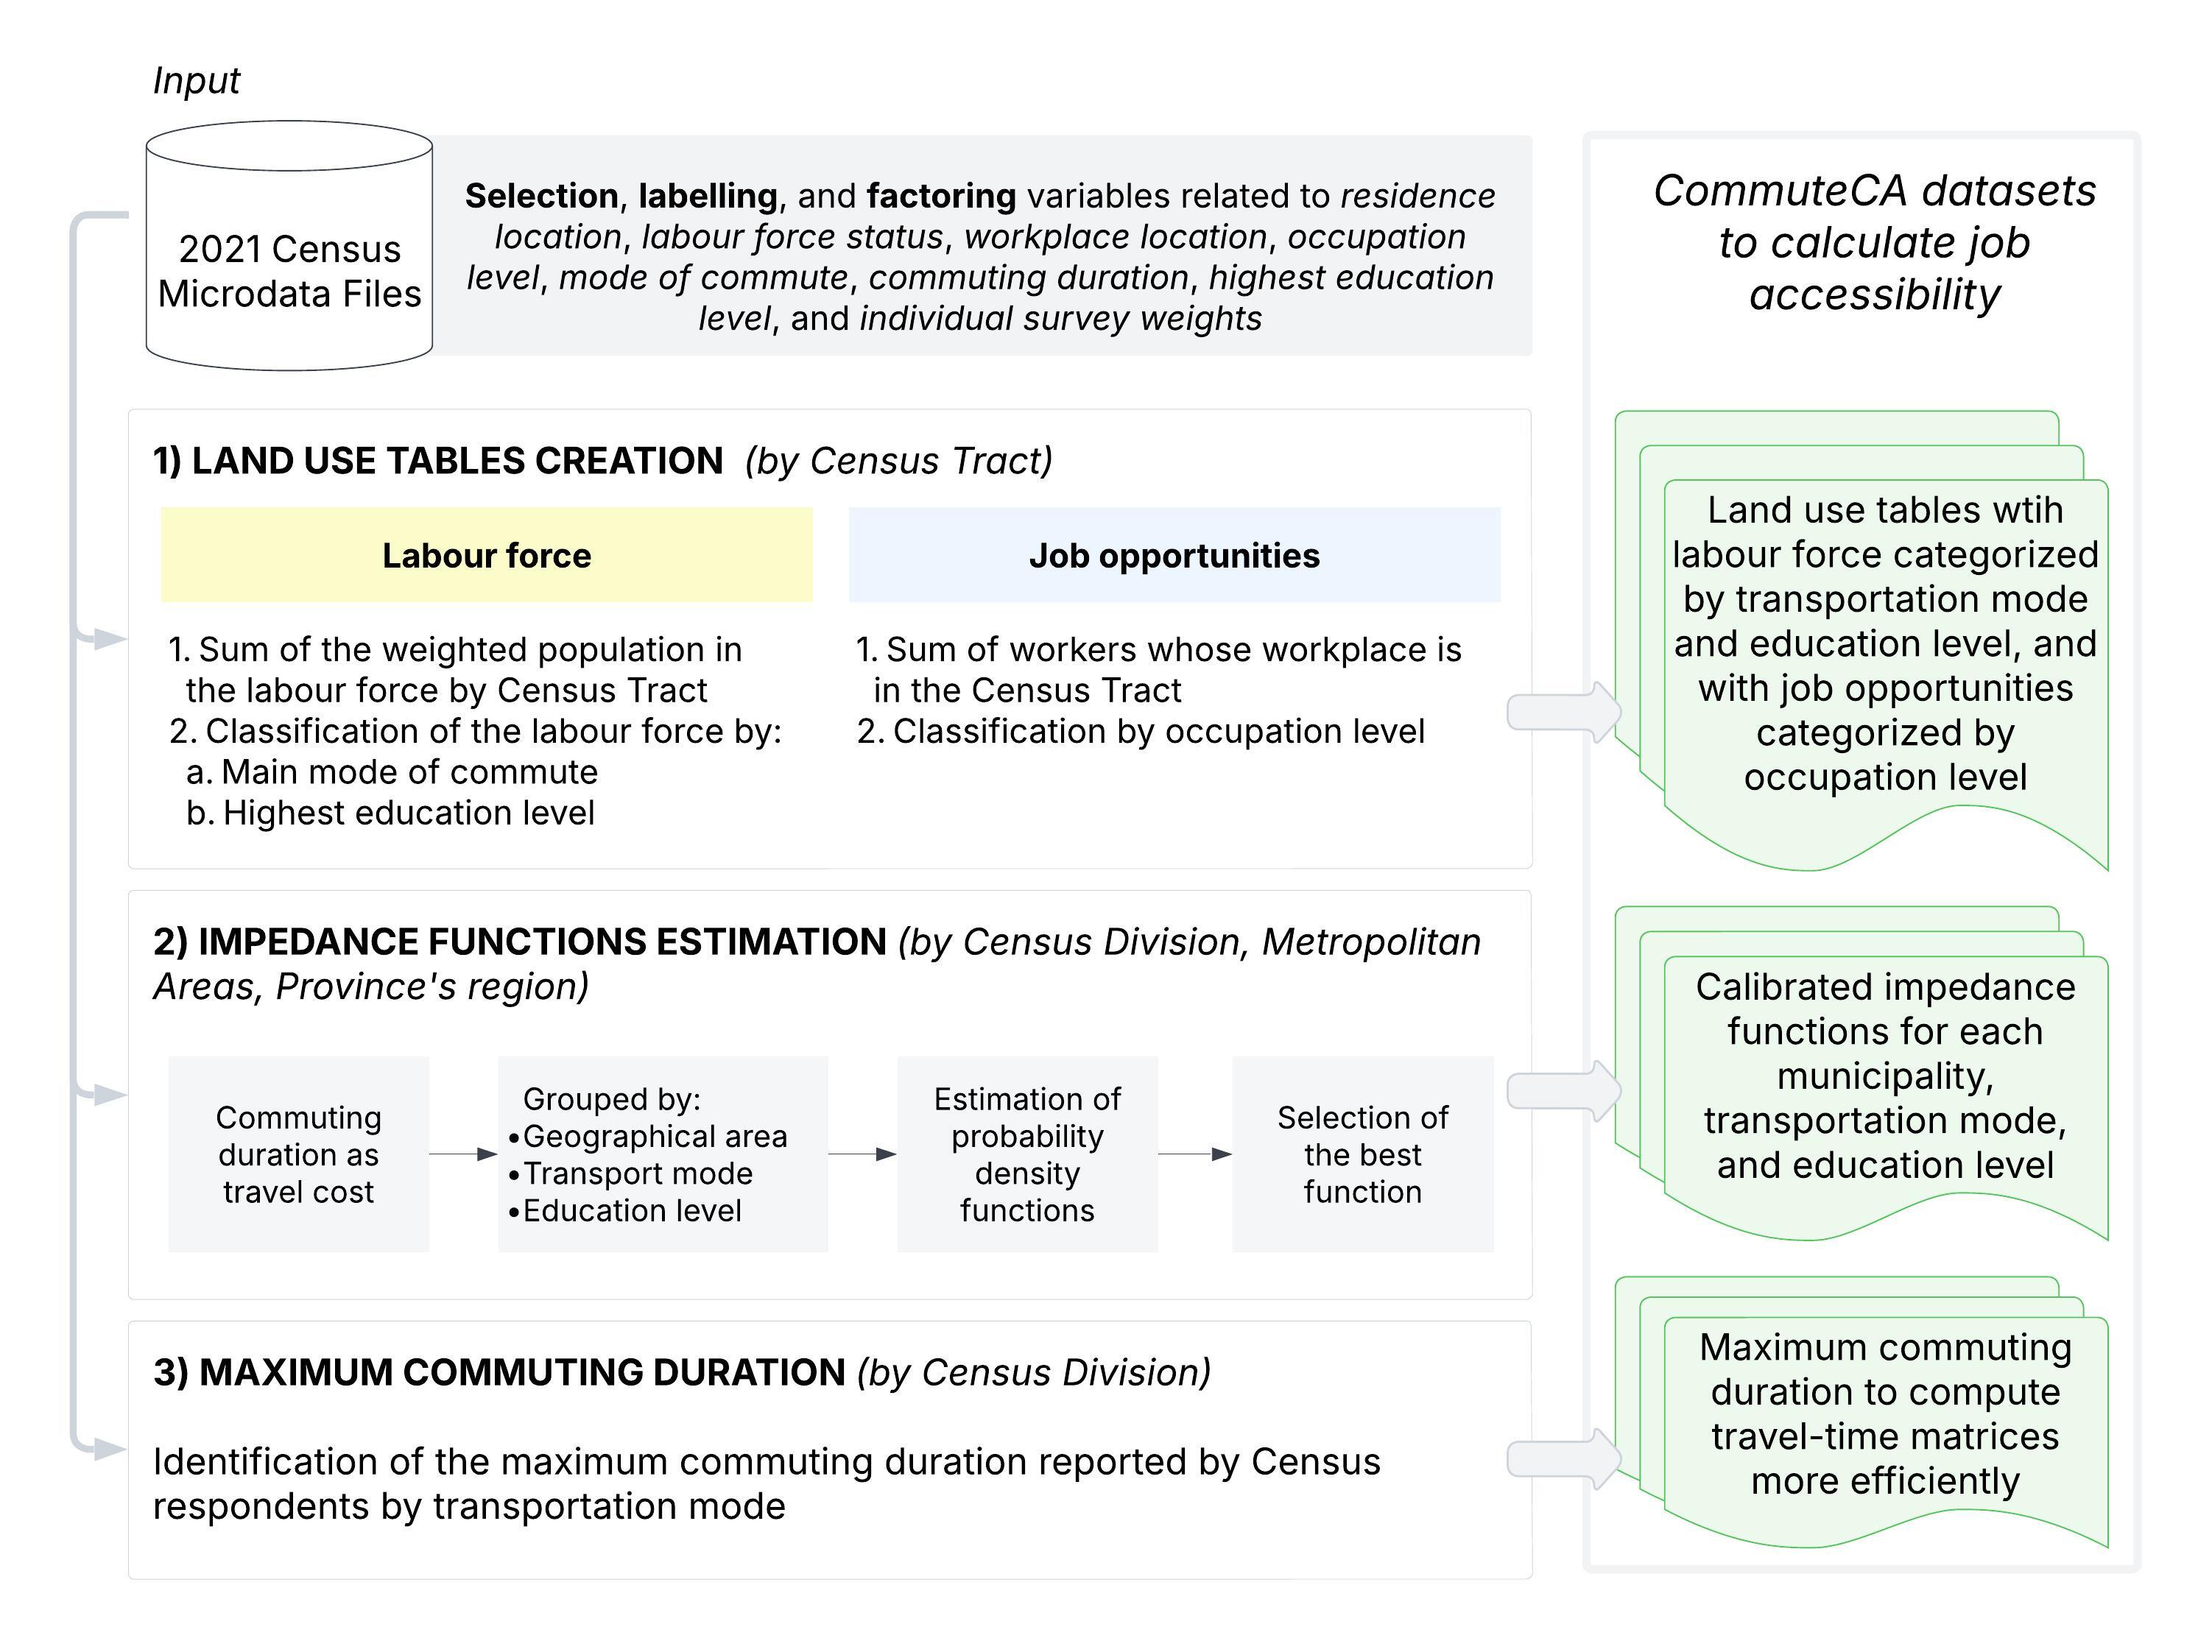
The package contains a series of datasets for accessibility analysis and other transportation studies. The datasets include calibrated impedance functions for job destinations across walking, cycling, public transit, and motorized vehicle modes, categorized or not by education level. These functions are provided at three geographic levels: Census Divisions (Municipality), Census Metropolitan Areas (CMA) and Census Agglomerations (CA), and Census Metropolitan Influenced Zones within Province and Territories.
The code bellow display the calibrated impedance functions for the City of Toronto (Census Division Code (PCD) = 3520):
library("CommuteCA")
library("dplyr")
#>
#> Attaching package: 'dplyr'
#> The following objects are masked from 'package:stats':
#>
#>     filter, lag
#> The following objects are masked from 'package:base':
#>
#>     intersect, setdiff, setequal, union

data("pcd_impedance_functions") # Load provincial impedance functions

pcd_impedance_functions %>%
  filter(PCD == "3520") %>% # Filter for the City of Toronto
  dplyr::select(PCDNAME, PRNAME, PwMode_label, Distribution, est_1, est_2) # Display key columns
#> # A tibble: 4 × 6
#>   PCDNAME PRNAME  PwMode_label   Distribution est_1  est_2
#>   <fct>   <fct>   <fct>          <fct>        <dbl>  <dbl>
#> 1 Toronto Ontario Public transit Gamma         3.60 0.0788
#> 2 Toronto Ontario Car-motorized  Gamma         2.33 0.0861
#> 3 Toronto Ontario Walk           Gamma         1.33 0.0849
#> 4 Toronto Ontario Bike           Log-normal    2.94 0.648
Another way to search for the functions is by using the search_impedance_function() function from CommuteCA:
search_impedance_function(code = 3520, type = "PCD")
#>   code type   PwMode_label               Education Distribution   est_1   est_2
#> 1 3520  PCD           Bike All levels of education   Log-normal 2.93888 0.64825
#> 2 3520  PCD           Walk All levels of education        Gamma 1.33045 0.08492
#> 3 3520  PCD  Car-motorized All levels of education        Gamma 2.32897 0.08613
#> 4 3520  PCD Public transit All levels of education        Gamma 3.60068 0.07877
#>   source
#> 1    PCD
#> 2    PCD
#> 3    PCD
#> 4    PCD
To split the calibrated functions by education level:
search_impedance_function(code = 3520, use_education = TRUE, type = "PCD")
#>    code type   PwMode_label                             Education Distribution
#> 1  3520  PCD           Bike College or apprenticeship certificate   Log-normal
#> 2  3520  PCD           Bike         High school or no certificate   Log-normal
#> 3  3520  PCD           Bike      University certificate or higher        Gamma
#> 4  3520  PCD           Walk College or apprenticeship certificate        Gamma
#> 5  3520  PCD           Walk         High school or no certificate        Gamma
#> 6  3520  PCD           Walk      University certificate or higher        Gamma
#> 7  3520  PCD  Car-motorized College or apprenticeship certificate        Gamma
#> 8  3520  PCD  Car-motorized         High school or no certificate        Gamma
#> 9  3520  PCD  Car-motorized      University certificate or higher        Gamma
#> 10 3520  PCD Public transit College or apprenticeship certificate        Gamma
#> 11 3520  PCD Public transit         High school or no certificate        Gamma
#> 12 3520  PCD Public transit      University certificate or higher        Gamma
#>      est_1   est_2 source
#> 1  2.94994 0.71079    PCD
#> 2  2.80623 0.79204    PCD
#> 3  3.15405 0.13606    PCD
#> 4  1.11745 0.07031    PCD
#> 5  1.30547 0.08843    PCD
#> 6  1.43916 0.08964    PCD
#> 7  2.45437 0.09013    PCD
#> 8  2.10548 0.07903    PCD
#> 9  2.45621 0.09007    PCD
#> 10 3.53751 0.07519    PCD
#> 11 3.31859 0.07375    PCD
#> 12 3.88187 0.08529    PCD
Next, you can use the generate_impedance() function to calculate the impedance value given a travel cost (duration):
specific_function <- search_impedance_function(code = 3520,
                                               use_education = TRUE,
                                               type = "PCD")
max_dur <- 90

expanded_df <- specific_function %>%
  slice(rep(seq_len(nrow(.)), each = max_dur)) %>%
  mutate(t = rep(seq_len(max_dur), times = nrow(specific_function)))

tld_theoretical <- generate_impedance(df = expanded_df,
                                      travel_cost_col = "t",
                                      distribution_col = "Distribution",
                                      est1_col = "est_1",
                                      est2_col = "est_2",
                                      output_col = "f")

head(tld_theoretical)
#> # A tibble: 6 × 7
#>    code type  PwMode_label Education                         source     t      f
#>   <dbl> <chr> <chr>        <chr>                             <chr>  <int>  <dbl>
#> 1  3520 PCD   Walk         College or apprenticeship certif… PCD        1 0.0508
#> 2  3520 PCD   Walk         College or apprenticeship certif… PCD        2 0.0514
#> 3  3520 PCD   Walk         College or apprenticeship certif… PCD        3 0.0502
#> 4  3520 PCD   Walk         College or apprenticeship certif… PCD        4 0.0484
#> 5  3520 PCD   Walk         College or apprenticeship certif… PCD        5 0.0463
#> 6  3520 PCD   Walk         College or apprenticeship certif… PCD        6 0.0441
The package also includes land use tables with labour force population and job counts for census tracts. The code below visualizes Toronto’s labour force by transportation mode for some census tracts:
data("labour_force_CT_mode") # Land Use data with information of labour force considering transportation modes

labour_force_3520 <- labour_force_CT_mode %>%
  filter(PCD == 3520) %>% # Filtering data for the city of Toronto
  dplyr::select(CTUID, PwMode_label, labour_force_rounded)

head(labour_force_3520)
#> # A tibble: 6 × 3
#>   CTUID      PwMode_label          labour_force_rounded
#>   <fct>      <fct>                                <dbl>
#> 1 5350001.00 Public transit                          30
#> 2 5350001.00 Car-motorized                          110
#> 3 5350001.00 Other or non-commuter                  230
#> 4 5350001.00 Walk                                    35
#> 5 5350002.00 Other or non-commuter                  165
#> 6 5350002.00 Car-motorized                           35
Now, the job opportunities:
data("jobs_CT_general") # Land Use data with information of number of jobs

jobs_3520 <- jobs_CT_general %>%
  filter(PCD == 3520) %>% # Filtering data for the city of Toronto
  dplyr::select(CTUID, jobs_rounded)

head(jobs_3520)
#> # A tibble: 6 × 2
#>   CTUID      jobs_rounded
#>   <fct>             <dbl>
#> 1 5350001.00         5805
#> 2 5350002.00          295
#> 3 5350003.00          195
#> 4 5350004.00         1395
#> 5 5350005.00         2735
#> 6 5350007.01         1135
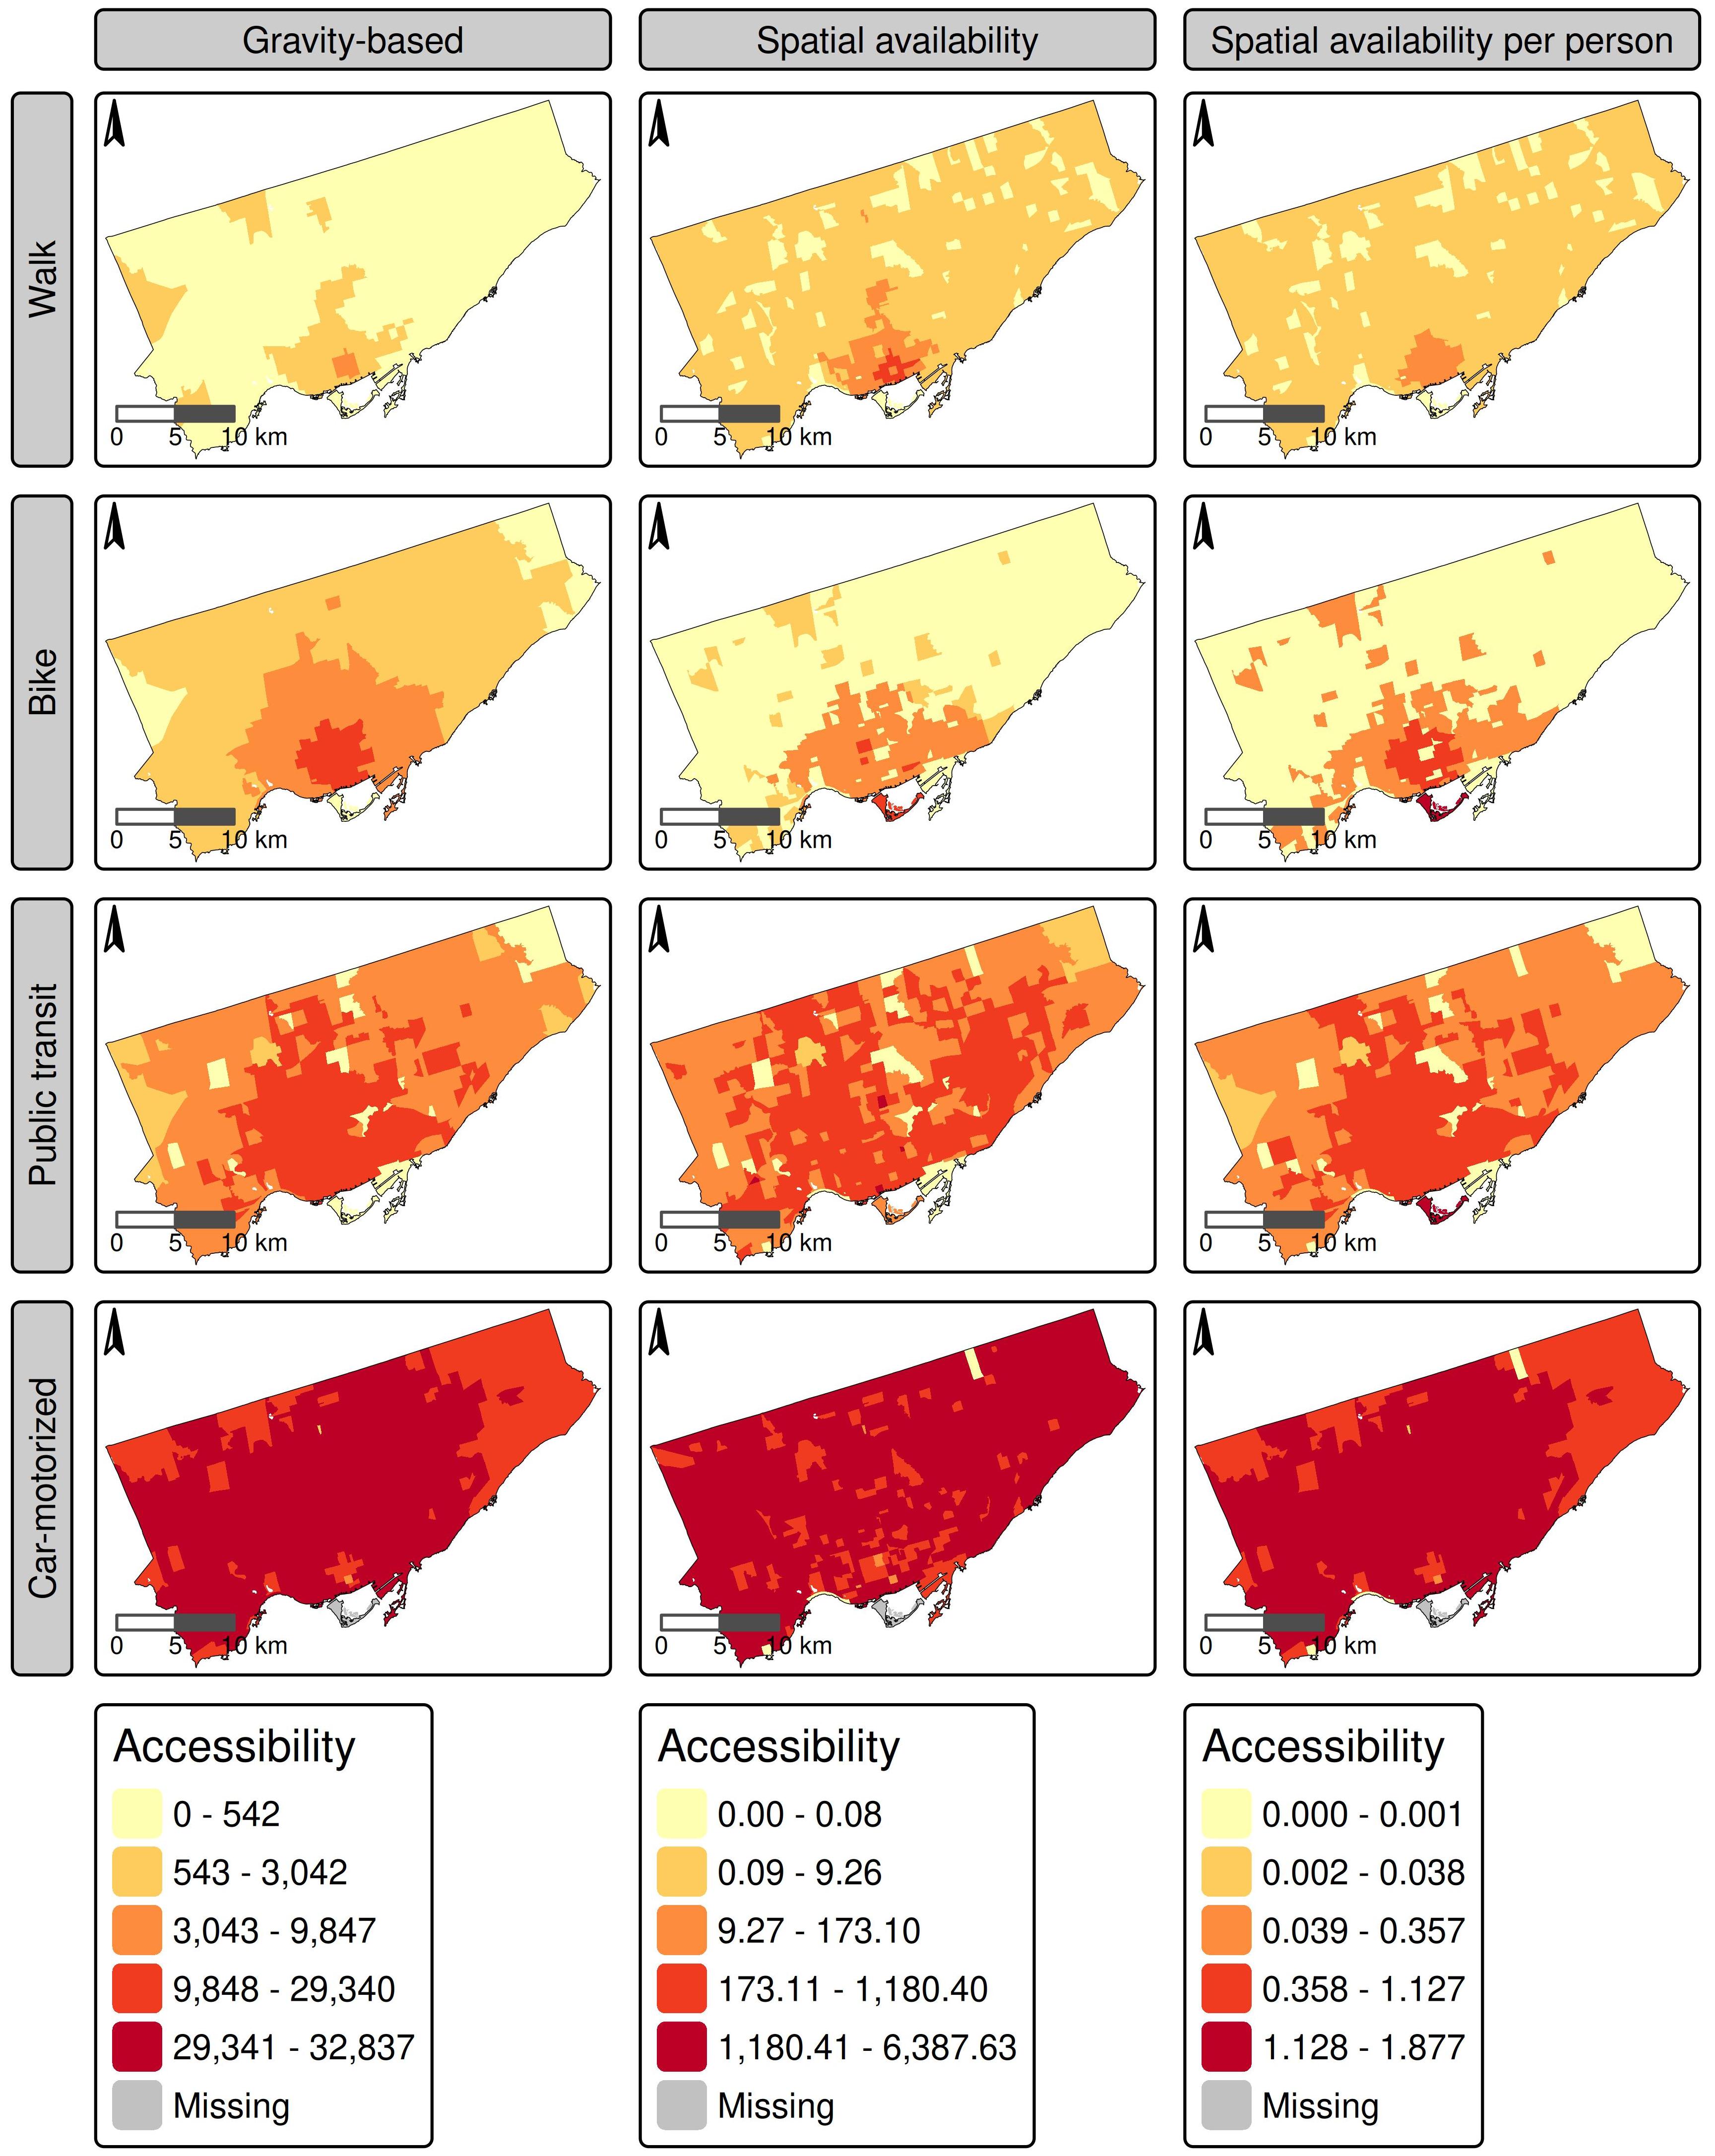
These datasets enable census tract-level accessibility analysis. For instance, we can use these two datasets to calculate the gravity-based accessibility by Hansen (1959) and (multimodal) spatial availability by Soukhov et al. (2024):
Explanation of the R markdown Templates
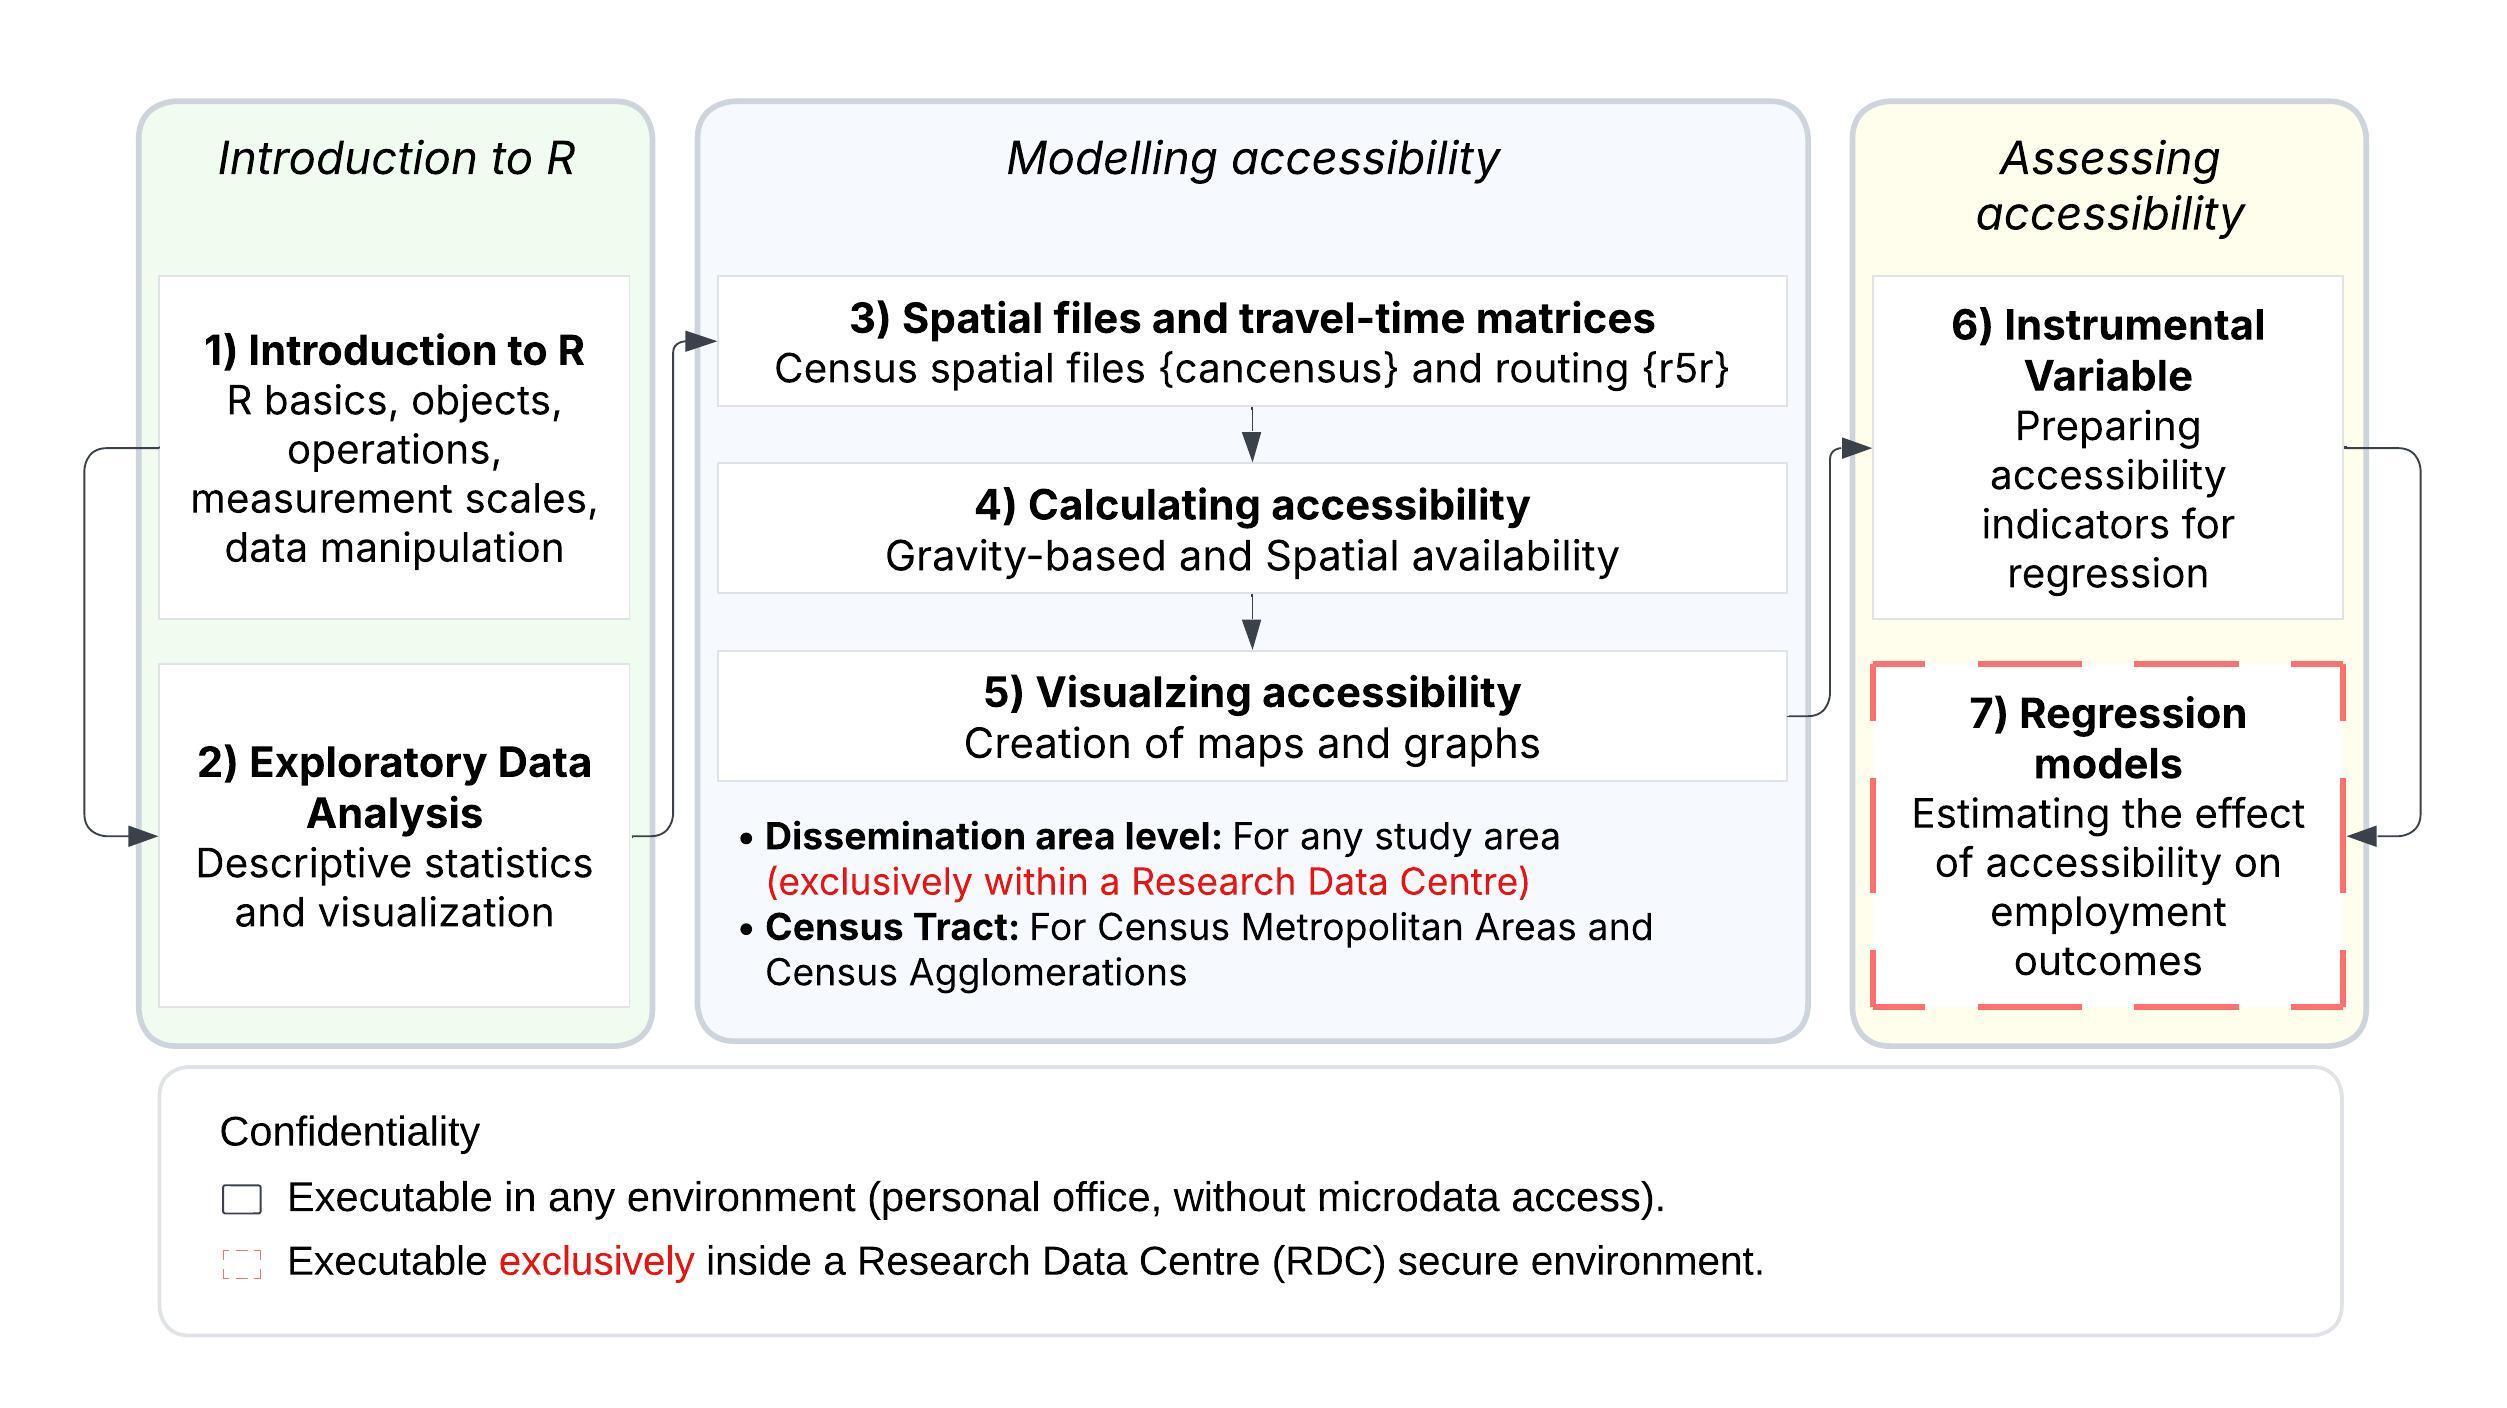
The {CommuteCA} package includes R Markdown templates that guide users through the entire accessibility analysis workflow. As illustrated in Figure , these templates enable analysts to:
- Mode job accessibility at the Census Tract (CT) level for multiple CMAs and CAs without requiring special access to confidential census microdata files.
- Model job accessibility at the Dissemination Area (DA) level for any study area in Canada, including areas outside metropolitan regions. Exclusively for researchers with access to census microdata files.
The R Markdown files are available in the /data-raw folder if you clone the repository from GitHub. If you have installed the package, you can access the R Markdown templates in RStudio by navigating to File > New File > R Markdown... > From Template and selecting one of the CommuteCA R Markdown templates.
The package provides seven (for now) R Markdown templates, organized into three progressive groups:
-
Group 1: Introduction to R (Templates 1 to 2):
- Template 1: To introduces the R language, literate programming concepts, data objects, basic operations, measurement scales, and fundamental data manipulation techniques.
- Template 2: To perform exploratory data analysis, including descriptive statistics and appropriate visualizations for different variable types.
-
Group 2: Accessibility Modelling (Templates 3 to 5)
- Template 3: To obtain spatial files via the {cancensus} package, and generating travel-time matrices using the {r5r} routing engine.
- Template 4: To calculate job accessibility using both the traditional Hansen accessibility measure (gravity model) and the spatial availability model proposed by Soukhov et al. (2023).
- Template 5: To create maps to visualize job accessibility indicators.
-
Group 3: Assessing Accessibility (Templates 6 to 7)
- Template 6: To construct spatial filters for accessibility indicators.
- Template 7: To estimate regression models that link accessibility to employment outcomes.
Installation
You can install the development version of CommuteCA from:
install.packages("pak")
pak::pak("dias-bruno/CommuteCA")